| |
Analyzing web use statistics
Your FirstClass system logs all web user activity in its web use statistics files. The Log Analyzer allows you to run analyses of this activity.
Web use analysis settings
Web Use analysis preferences control what information is displayed in your web use analyses. To set web use analysis preferences:
1 Open Log Analyzer.
2 Click Settings.
3 Click Web/Voice.
4 Click Web Log.
Setting log time and date preferences
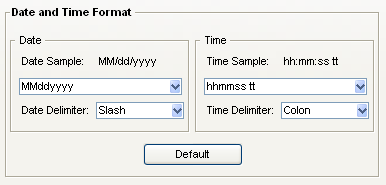
The web use statistics uses the time and date format of the computer where Internet Services is running by default. You must set the Log Analyzer to these formats to ensure its settings are in sync with data in your web use statistics. To set the log time and date preferences:
1 Open the web use settings.
2 Select Log Type / Date and Time.
3 Choose your time and date formats and delimiters at "Time" and "Date" respectively.
4 Click Default to use the default time and date format of the computer Log Analyzer is installed on.
Setting the basic web use analysis preferences
To set the basic analysis preferences for the web use server analysis:
1 Open the web use settings.
2 Select Analysis.
3 Configure what will appear in the web use analysis:
Setting the web use chart preferences
The Web Use Chart preferences set the number of data points displayed on charts in your web use analysis. For example, if you set this value to 5 on any Web Use (bar) Chart, 5 bars would be displayed. To change the number of data points shown per chart:
1 Open the web use settings.
2 Select Web Preferences.
3 Choose or enter the number you desire in the text box.
If there are more data points to be plotted than there are data points to be displayed per chart, a blue arrow will appear in the right corner of the first chart. Click the arrow to navigate to the remaining data points.
Setting the web use exclusion filtering preferences
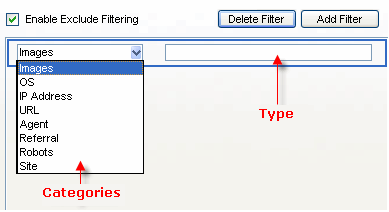
Sometimes it is not feasible to display all statistics file information. Use exclusion filtering to exclude unwanted data.
To enable exclusion filtering for web statistics:
1 Open the web use settings.
2 Select Filters.
3 Select Enable Exclude Filtering.
4 Choose one of the categories from the dropdown at Categories.
5 Choose the type of data you would like to filter at Type.
6 (optional) Click Add Filter to set up another exclusion filter.
Setting the IP to Country preferences
The IP to Country settings allow you to specify the number of countries you want displayed in your location analysis section of your web use analysis. To set the IP to Country preferences for your web use analyses:
1 Open Log Analyzer.
2 Click Settings.
3 Click Preferences/Schedule.
4 Click Preferences.
5 Select the IP to Country tab.
6 Select Load IP to Country Data to display the countries from which the most internet activity originated.
7 Choose the number of countries displayed in your web use analyses at "Show Top Countries".
Viewing the web use analysis
To view your web use analysis after processing is complete, click View on the Log Analyzer main window.
The web use analysis summary
To view the web use analysis summary:
1 Click Summary in the navigation bar in the web use analysis main window.
2 Click the Summary.
Viewing the host sites analysis summary
The host sites analysis summary provides an overview of activity among your host sites. To view the host sites analysis summary:
1 Click Summary in the navigation bar in the web use analysis main window.
2 Click Host Sites.
If there are more data points to be plotted on your chart than you chose in your web preferences, a blue arrow will appear in the bottom right corner of your summary charts. Click the arrow to view charts of the remaining data points.
Viewing the Operating System analysis summary
The OS analysis summary provides a breakdown of the operating systems used by users who accessed any of the host sites.
To view the OS analysis summary:
1 Click Summary in the navigation bar in the web use analysis main window.
2 Click OS.
Viewing the IP address analysis summary
The IP address analysis summary gives an overview of web activity based on IP addresses. To view the IP address analysis summary:
1 Click Summary in the navigation bar in the web use analysis main window.
2 Click IP Address.
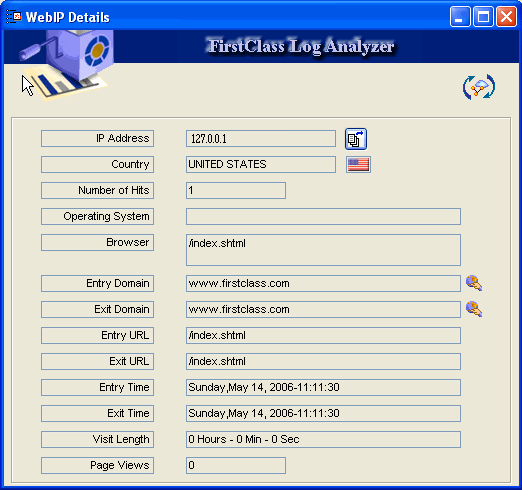
To view the analysis details for a particular IP address, double-click it:
Viewing the location analysis summary
The location analysis summary displays the number of users who accessed the site by country/region. To view the location analysis summary:
1 Click Summary in the navigation bar in the web use analysis main window.
2 Click Location.
Viewing the browsers, PDA browsers and robots analyses
To view the Browsers, PDA Browsers, or Robots analyses:
1 Click Browsers/Robots in the navigation bar in the web use analysis main window.
2 Click Browsers, PDA Browsers, or Robots.
Browsers analysis
PDA Browsers analysis
Robots analysis
Viewing the pages analysis
Web pages analysis examines the number of hits received for a web page in a given category. To see the pages analysis, click Pages in the navigation bar in the web use analysis main window.
• To view the URLs analysis, click URLs.
• To view the referrals analysis, click Referrals.
• To view the entry pages analysis, click Entry Pages.
• To view the exit pages analysis, click Exit Pages.
Viewing the visits analyses
The visits analyses display the total number of hits received for a specified time interval.
Hourly visits analysis
Daily visits analysis
Monthly visits analysis
Viewing the home pages analysis
The home pages analysis summarizes the number of hits each user home page hosted by one of your host sites received. To view the home pages analysis:
1 Select the User Details tab of the web use analysis main window.
2 Click Home Pages.
| ||||||||||||||||||||||||||||||||||||||||||||||||||||||||||||||||||||||||||||||||||


