| |
Settings and general preferences
Log Analyzer general preferences
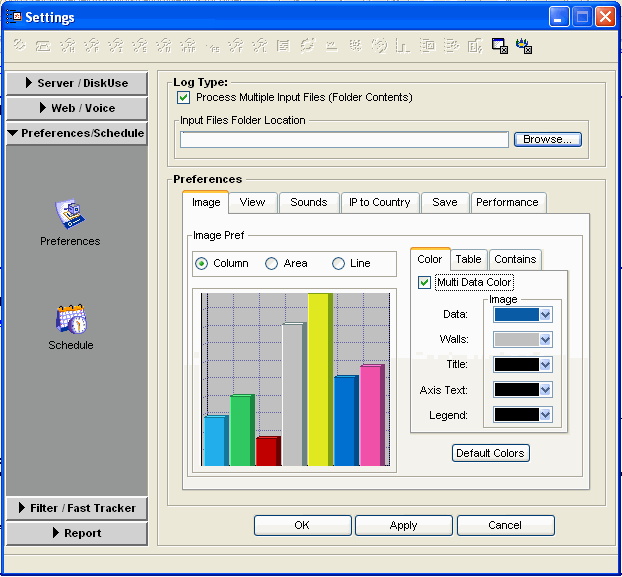
The Log Analyzer general preferences allows you to configure your analysis properties. These will be the same for all analyses generated. To access the general preferences:
1 Open Log Analyzer.
2 Click Settings.
3 Click Preference/Schedule.
4 Click Preferences.
Setting image display preferences
The image display preferences allow you to set your chart and table display properties for all displayed results. To set the image preferences:
1 Open Log Analyzer general preferences.
2 Select Image.
Setting view preferences
The view preferences determine whether or not your analysis is automatically displayed after file processing. To set your view preferences:
1 Open Log Analyzer general preferences.
2 Select View.
3 Select View Report After File Is Processed.
Setting audio alert preferences
The audio alert preferences allow you to set whether or not an alert is played for certain processing events. To set your audio alert preferences:
1 Open Log Analyzer general preferences.
2 Select Sound.
3 Select any or none of the following as desired:
• Play Sound After File is Processed
• Play Sound on Error
Setting IP to Country preferences
This setting is explained in user statistics and web use analysis.
Setting saving preferences
This setting is used specifically for user statistics analysis.
Setting performance data preferences
Thissetting is used specifically for the user statistics analysis.
| ||||||||||||

